Vinn's Studio

OHLC

Word count: 745Reading time: 4 min
2021/10/27 Share

在股票市场中,经常需要对开盘价,收盘价,最低价最高价等进行可视化分析,来寻找股市中的规律,为此就需要绘制 OHLC 图。

OHLC 图的定义

OHLC 图的每个时间点由如下四个数据生成:

  • O:代表开盘汇率 Open
  • H:代表最高汇率 High
  • L:代表最低汇率 Low
  • C:代表收盘汇率 Close

如图所示,OHLC 图的一个时间点中,中间的垂线由最高点最低点连接而成,两边的横线分别由开盘点收盘点与中间线连接而成。

代码实现

选择使用 plotly.com 数据可视化平台提供的 api 进行绘制,相关代码如下:

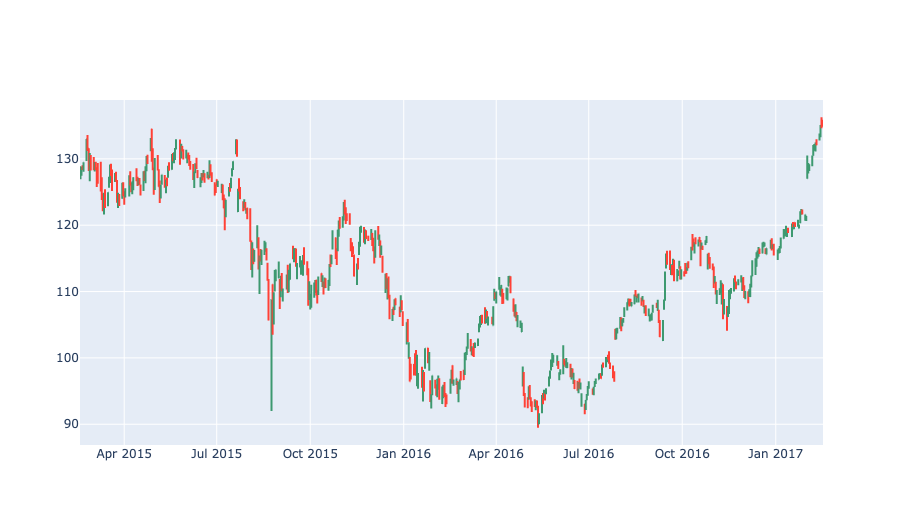
Simple OHLC Chart with Pandas

1
2
3
4
5
6
7
8
9
10
11
import plotly.graph_objects as go
import pandas as pd

df = pd.read_csv('https://raw.githubusercontent.com/plotly/datasets/master/finance-charts-apple.csv')

fig = go.Figure(data=go.Ohlc(x=df['Date'],
open=df['AAPL.Open'],
high=df['AAPL.High'],
low=df['AAPL.Low'],
close=df['AAPL.Close']))
fig.show()

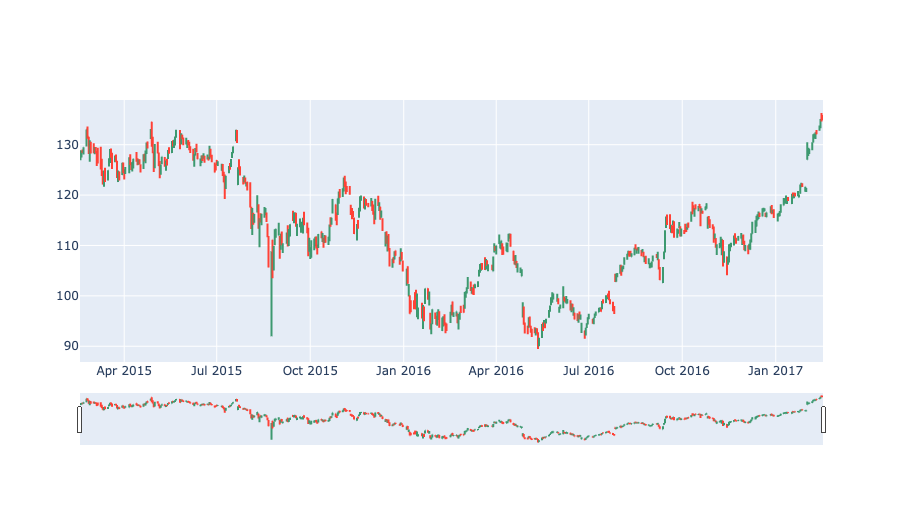
OHLC Chart without Rangeslider

1
2
3
4
5
6
7
8
9
10
11
12
13
14
import plotly.graph_objects as go

import pandas as pd


df = pd.read_csv('https://raw.githubusercontent.com/plotly/datasets/master/finance-charts-apple.csv')

fig = go.Figure(data=go.Ohlc(x=df['Date'],
open=df['AAPL.Open'],
high=df['AAPL.High'],
low=df['AAPL.Low'],
close=df['AAPL.Close']))
fig.update(layout_xaxis_rangeslider_visible=False)
fig.show()

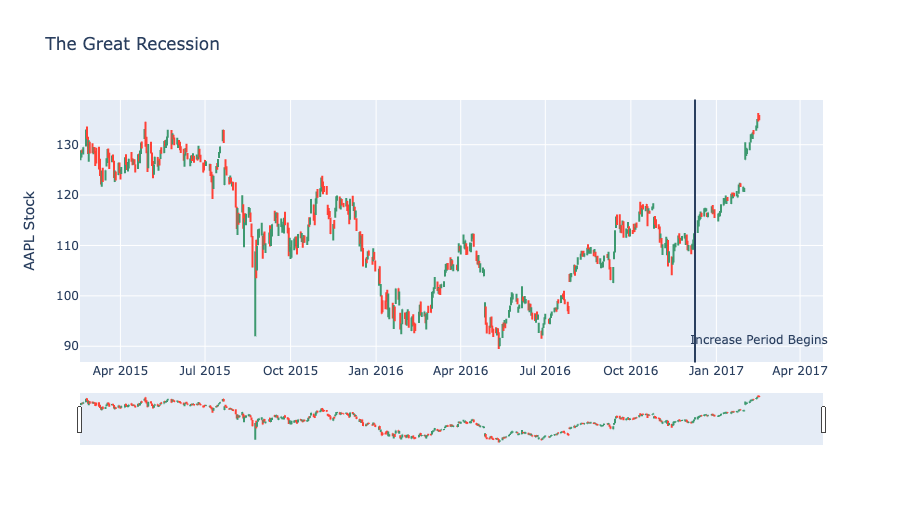
Adding Customized Text and Annotations

1
2
3
4
5
6
7
8
9
10
11
12
13
14
15
16
17
18
19
20
21
22
23
import plotly.graph_objects as go
import pandas as pd

df = pd.read_csv('https://raw.githubusercontent.com/plotly/datasets/master/finance-charts-apple.csv')

fig = go.Figure(data=go.Ohlc(x=df['Date'],
open=df['AAPL.Open'],
high=df['AAPL.High'],
low=df['AAPL.Low'],
close=df['AAPL.Close']))

fig.update_layout(
title='The Great Recession',
yaxis_title='AAPL Stock',
shapes = [dict(
x0='2016-12-09', x1='2016-12-09', y0=0, y1=1, xref='x', yref='paper',
line_width=2)],
annotations=[dict(
x='2016-12-09', y=0.05, xref='x', yref='paper',
showarrow=False, xanchor='left', text='Increase Period Begins')]
)

fig.show()

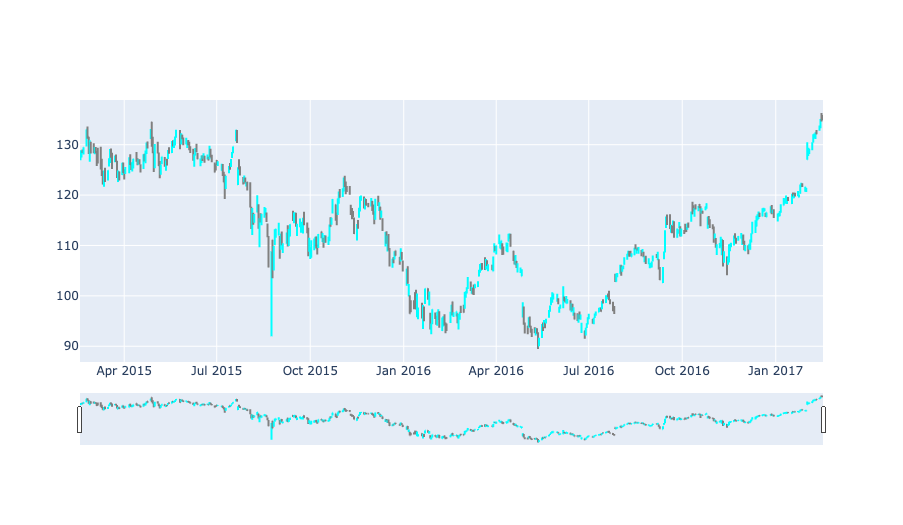
Custom OHLC Colors

1
2
3
4
5
6
7
8
9
10
11
12
import plotly.graph_objects as go
import pandas as pd

df = pd.read_csv('https://raw.githubusercontent.com/plotly/datasets/master/finance-charts-apple.csv')

fig = go.Figure(data=[go.Ohlc(
x=df['Date'],
open=df['AAPL.Open'], high=df['AAPL.High'],
low=df['AAPL.Low'], close=df['AAPL.Close'],
increasing_line_color= 'cyan', decreasing_line_color= 'gray'
)])
fig.show()

Simple OHLC with datetime Objects

1
2
3
4
5
6
7
8
9
10
11
12
13
14
15
16
17
18
import plotly.graph_objects as go

from datetime import datetime

open_data = [33.0, 33.3, 33.5, 33.0, 34.1]
high_data = [33.1, 33.3, 33.6, 33.2, 34.8]
low_data = [32.7, 32.7, 32.8, 32.6, 32.8]
close_data = [33.0, 32.9, 33.3, 33.1, 33.1]
dates = [datetime(year=2013, month=10, day=10),
datetime(year=2013, month=11, day=10),
datetime(year=2013, month=12, day=10),
datetime(year=2014, month=1, day=10),
datetime(year=2014, month=2, day=10)]

fig = go.Figure(data=[go.Ohlc(x=dates,
open=open_data, high=high_data,
low=low_data, close=close_data)])
fig.show()

Custom Hovertext

1
2
3
4
5
6
7
8
9
10
11
12
13
14
15
16
17
18
19
import plotly.graph_objects as go

import pandas as pd
from datetime import datetime

hovertext=[]
for i in range(len(df['AAPL.Open'])):
hovertext.append('Open: '+str(df['AAPL.Open'][i])+'<br>Close: '+str(df['AAPL.Close'][i]))

df = pd.read_csv('https://raw.githubusercontent.com/plotly/datasets/master/finance-charts-apple.csv')

fig = go.Figure(data=go.Ohlc(x=df['Date'],
open=df['AAPL.Open'],
high=df['AAPL.High'],
low=df['AAPL.Low'],
close=df['AAPL.Close'],
text=hovertext,
hoverinfo='text'))
fig.show()

CATALOG
  1. OHLC 图的定义
  2. 代码实现
    1. Simple OHLC Chart with Pandas
    2. OHLC Chart without Rangeslider
    3. Adding Customized Text and Annotations
    4. Custom OHLC Colors
    5. Simple OHLC with datetime Objects
  3. Custom Hovertext